

Quick answer
Goal Seek
Find one input for a target output
Break-even, target margin, required headcount.
Data Table
Sensitivity across a range of inputs
Pricing tiers, EMI across rates, break-even bands.
Scenario Manager
Compare named plans side by side
Base / Best / Worst, three hiring plans, two targets.
Every business question is a what-if question. What if rates go up 100 basis points? What if we hire five more people? What if list price drops 8%? Excel ships three tools for this - Goal Seek, Data Tables and Scenario Manager - and most analysts use none of them. They rebuild the spreadsheet by hand, retype inputs, and miss the one answer that matters. Here is the three-tool kit and the one rule that makes it work.
What is What-If Analysis in Excel?
What-If Analysis is the set of tools in Excel that let you change input values and see how those changes flow through your formulas - without rebuilding the spreadsheet. Excel ships three what-if tools on the Data tab: Goal Seek, Data Tables, and Scenario Manager. Each one answers a different kind of business question. Goal Seek finds the one input that produces a target output. Data Tables show how one or two variables affect a formula across a range of values. Scenario Manager lets you save named sets of inputs and switch between them with a click.
The one rule before you start
What-if analysis only works when the model is built off a small number of named cells. If the loan rate is typed into ten formulas, Goal Seek cannot help you - it can only change one cell at a time. If the headcount number lives in five places, a Data Table cannot show the sensitivity cleanly. The first step is the same every time: pick the assumption, put it in a single named cell on an Assumptions tab, and rebuild every downstream formula to reference that cell. The first hour of cleanup pays for itself the first time you run a what-if.
The three tools, in plain English
- 01
Goal Seek
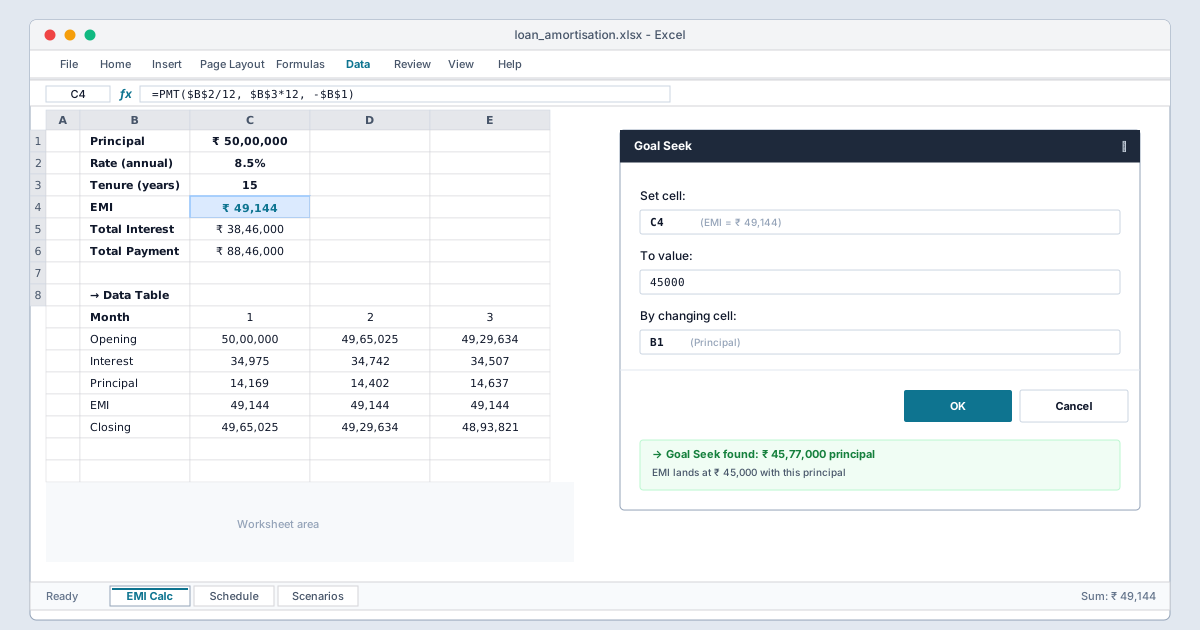
· When you know the answer and need the input that produces itI need the loan EMI to be ₹45,000 - what should the principal be? I need gross margin to be 32% - what does list price have to be? Goal Seek flips the equation once, gives you the answer, leaves the formula alone.
- 02
Data Table
· When you want to see the answer change across a range of inputsTwo flavors: a one-input table that runs one formula across a column of inputs, and a two-input table that runs one formula across a matrix. The classic use is a loan amortisation across rates and tenures - one block of cells, the entire sensitivity in front of you.
- 03
Scenario Manager
· When you want to compare named sets of inputs side by sideBuild a Best Case, Worst Case and Base Case as named scenarios. Pivot between them with a single click. The report updates; the underlying model does not move. The most under-used tool in Excel.
A five-line recipe for any what-if model
We use the same five-step recipe on every model we build, regardless of the business. A budget, a forecast, a pricing model, a hiring plan - they all start the same way.
- 1
Put the assumption in its own named cell - loan rate, headcount, list price, fuel cost.
- 2
Build the rest of the model off that one cell. Every downstream number should reference it.
- 3
For one-shot questions, use Goal Seek - Data > What-If Analysis > Goal Seek.
- 4
For sensitivity, build a Data Table - Data > What-If Analysis > Data Table.
- 5
For side-by-side plans, use Scenario Manager - Data > What-If Analysis > Scenario Manager.
Three gotchas that bite everyone
Most what-if failures are not the model - they are the setup. Three rules catch almost every one.
- 1
Goal Seek changes a cell, not a formula
When Goal Seek finds the input that produces your target, it types that number into the cell. The original formula or value is replaced until you undo. Always run Goal Seek on a copy of the input cell, or save the workbook first.
- 2
Data Tables must be on the same sheet as the formula
A one-input or two-input Data Table can only reference a formula that lives on the same worksheet. The formula does not need to be in the table - it can sit anywhere on the sheet - but it has to be there, not on another tab.
- 3
F9 recalculates. Shift+F9 recalculates the active sheet. Ctrl+Alt+F9 forces a full recalc.
When scenarios or what-if values are not updating, it is almost always because the workbook is in Manual Calculation mode. Formulas > Calculation Options > Automatic. If a model must stay manual, remember F9 before you read the numbers.
Start with one model
Pick the one spreadsheet you rebuild every time something changes. Put its assumptions in named cells. Build a one-input Data Table across the most-asked variable. Run Goal Seek for the break-even answer. Add three named scenarios for the cases your leadership team keeps asking about. The first what-if you ship is the one that converts you - every model after that gets built the same way.
Why building this yourself is harder than it looks
What-if analysis looks simple - three built-in tools, no formulas. The reality in working finance workbooks is messier. The assumptions live in five places, not one. The formula references them by cell, not by name, so renaming a row breaks every downstream calculation. The Data Table works on the test sheet but errors on the live workbook because the formula lives on a different tab. Goal Seek returns "may not have found a solution" because the equation has no real root - usually a data error, sometimes the model is simply wrong.
The first what-if tool we build on a real-world model takes about a day of cleanup before it actually runs. Renaming assumptions into named cells, moving the formula to the same sheet as the Data Table, catching the hard-coded values that defeat Goal Seek. Without that setup, every what-if answer is unreliable. With it, the model answers the question in a click.
The 80/20 of what-if work is the setup. The 20% is the tool itself. Most teams that try to DIY it never get past the setup, and they never trust the answers they get.
What a senior Excel consultant actually delivers for what-if work
A what-if-ready model has four characteristics a typical finance workbook does not:
- One Assumptions tab. Every input - rate, headcount, price, FX, volume - lives on a single sheet with named ranges. Every downstream formula references the name, not the cell. Insert a row in the assumptions, nothing breaks.
- A clean calculation chain. One formula per output, no hard-coded numbers mid-stream. The whole chain is auditable from assumption to answer in a single click.
- Three pre-built what-if views. Goal Seek for break-even, a one-input Data Table for sensitivity, three named scenarios (Base / Best / Worst) for the leadership deck. The model answers every standard question in one click.
- A summary tab. The three scenarios compared side by side on a single page, with the key outputs (cash, EBITDA, headcount cost) on one row. Paste-ready for the chairman's pack.
The cleanup is usually most of the work: the three tools only behave once the assumptions are named and in one place. A fixed-scope build covers that cleanup as well as the tools.
What-if analysis vs sensitivity analysis - what is the difference?
What-if analysis is the broader term: any technique that flips inputs to see outputs change. Sensitivity analysis is a specific kind of what-if: it shows how sensitive one output is to one or two inputs across a continuous range. A Data Table is sensitivity analysis. Goal Seek is not - it solves a single equation, it does not show a range.
In practice:
- Use Goal Seek when you know the target output and need the one input that produces it - break-even, target margin, required headcount.
- Use a Data Table when you want to see the output move across a range of inputs - sensitivity, break-even bands, pricing tiers.
- Use Scenario Manager when you want to compare a small number of named plans side by side - Base / Best / Worst, three hiring plans, two acquisition targets.
Most finance models use all three. Goal Seek gives the break-even answer. The Data Table shows how the break-even moves with a second variable (interest rate, headcount). Scenario Manager names the three plans that go into the leadership deck. Knowing which tool answers which question is the easy part. Getting the model clean enough to use any of them is where most teams give up.
Related reading
- SUMPRODUCT - the function that replaces five for sensitivity calcs without an array formula.
- Dynamic Arrays - the Excel feature you didn't know you had if your scenarios need to spill into a grid instead of a single cell.
- Excel charts that tell a story for the visual side of presenting Base / Best / Worst to leadership.















