

A chart is a sentence. If the reader cannot say what it means within three seconds, the chart - not the reader - has failed. Here is how we choose and polish charts for client dashboards.
Match the chart to the question
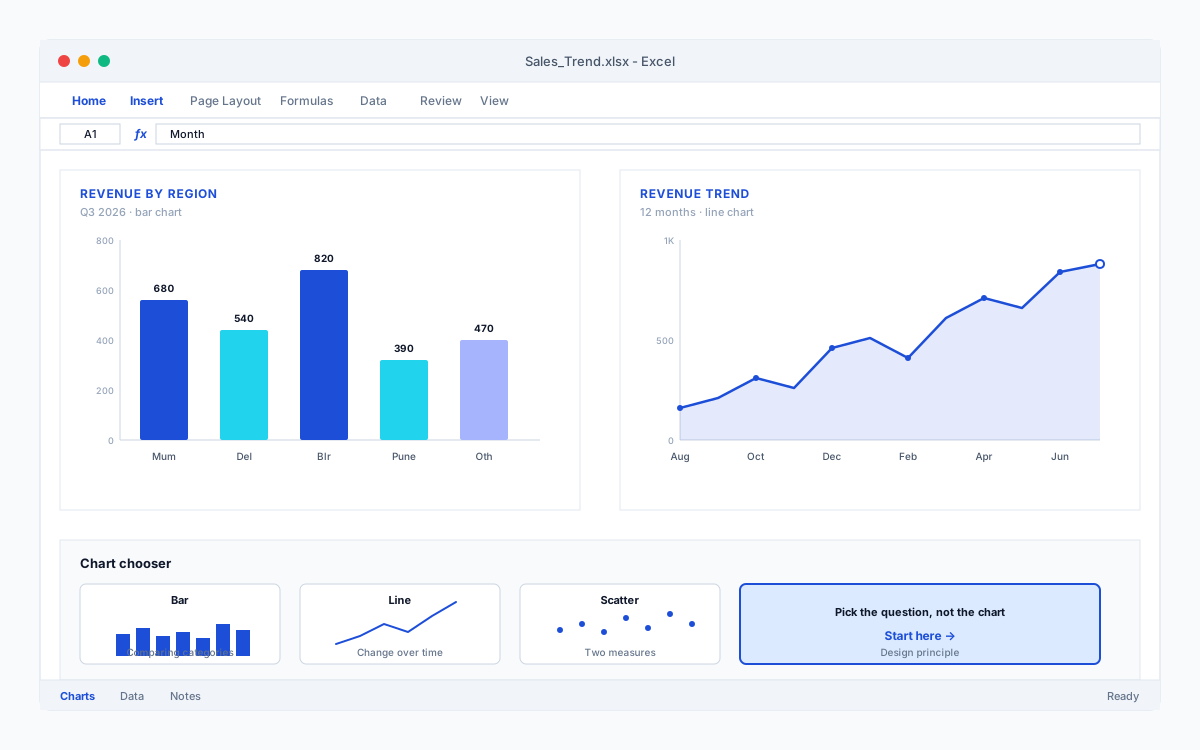
Comparing categories? Bar chart. Change over time? Line chart. Contribution to a whole? Stacked bar - almost never a pie once you have more than three slices. Relationship between two measures? Scatter. That single mapping decision does more for clarity than any amount of styling.
Delete before you decorate
Remove gridlines you do not need, borders, 3-D effects and legends with one entry. Every pixel that is not data is a pixel the reader has to ignore. The default charts in Excel are noisy; your job is subtraction.
Put the finding in the title
“Monthly Sales” tells the reader nothing. “Sales up 18% since the price change” tells them why the chart exists. Write the title last, after you know what the chart is saying.
Highlight one thing
Grey out every series except the one that matters. A twelve-line chart where eleven lines are grey and one is emerald green needs no explanation - the story is the colored line.














