

Power Pivot is the most powerful feature in Excel, the one nobody uses, and the one people who have tried it once and bounced off do not want to revisit. The reputation is unfair. Power Pivot is what happens when a pivot table stops being a tool for one table and becomes a tool for the whole business. The mental model is twenty minutes, the payoff is a workbook that stays fast at a million rows, and the team that uses the dashboard does not need to learn anything new - the pivot table looks the same as it always has.
Four myths that stop people before they start
Most analysts never try Power Pivot because of one of these four beliefs. All four are wrong, and the reason they are wrong is the part the documentation never tells you.
Power Pivot is a separate Microsoft product I have to install.
Power Pivot ships inside every modern copy of Excel. It is not a plugin, not an add-in, not a separate licence. The toggle is File > Options > Add-Ins > Manage COM Add-ins > Power Pivot. Enable it once and the Power Pivot window appears in your ribbon.
I have to learn DAX before I can use it.
You can build a working Power Pivot model without writing a line of DAX. Add tables, define relationships by clicking columns, and any pivot table built on top of the model just works. DAX becomes useful when you want calculated measures (year-to-date, running totals) - and the first ten DAX functions you need are five, not fifty.
Power Pivot is for “big data.” I only have 50K rows.
Power Pivot is for anyone who is tired of VLOOKUP across ten tables, who has hit the row limit of a single Excel sheet, or whose pivot table is now slow because the source data is too wide. The Data Model holds 2 billion rows in compressed columnar storage. A 50K-row model loads in under a second.
Power Pivot is a one-way door - once I commit, I cannot go back to normal pivot tables.
A pivot table built on top of the Data Model behaves exactly like a normal pivot table. The only difference is the source. The pivot itself is unchanged - same fields, same filters, same slicers, same drill-down. The team does not need to learn a new tool.
The mental model, in three things
Strip Power Pivot down to its bones and you get three concepts. Learn these, in order, and the rest is detail.
- 1
Tables
Every table in the model is one Power Query output (or a Table in the workbook). No formulas, no ranges, no data typing by hand. Each table has a name, a set of columns, and one purpose.
- 2
Relationships
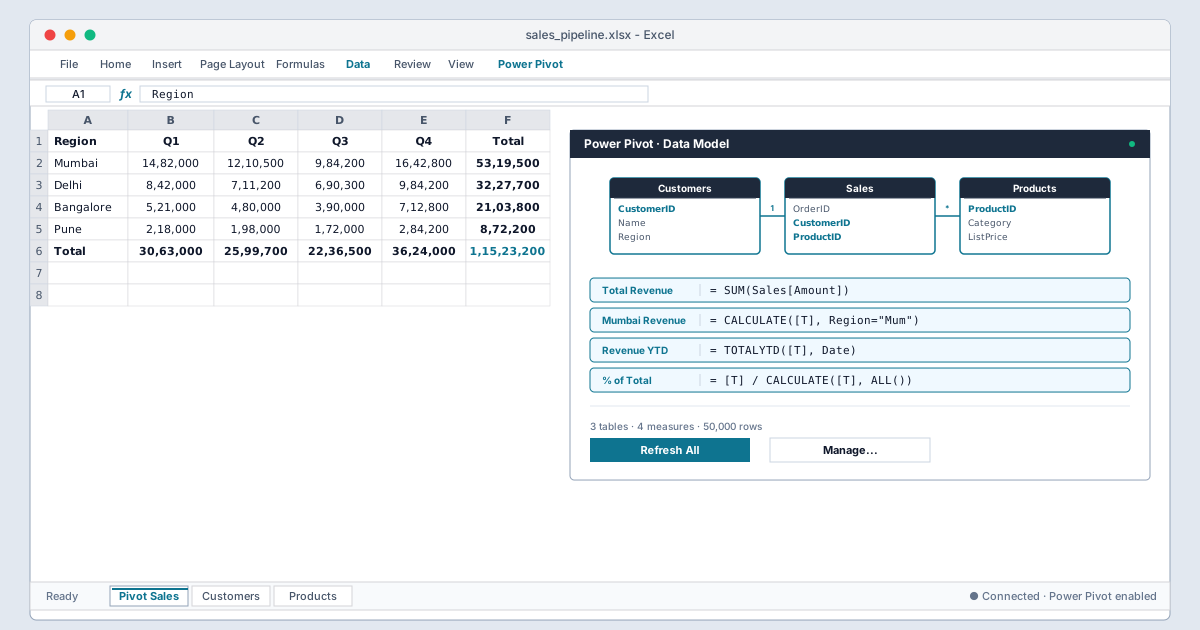
You connect tables by clicking a column in one and the matching column in another. The model knows Customer connects to Order via CustomerID. There is no VLOOKUP. The model has done the join for you, once, and every pivot uses it.
- 3
Measures
A measure is a single formula that lives on the model and recalculates based on the pivot context. SUM(Sales[Amount]) is the simplest. CALCULATE, FILTER, ALL, TIMEINTELLIGENCE are the four families that cover 90% of what analysts actually need.
The five DAX functions you actually need
DAX has a reputation for being huge. The reality is that five functions cover ninety percent of what an analyst needs. Learn these, and the rest is reference.
SUMThe same SUM you already know. Inside a measure, SUM(Sales[Amount]) is the canonical way to add a column. No new mental model required.CALCULATEThe function that changes the filter context. =CALCULATE(SUM(Sales[Amount]), Region[Region]=“Mumbai”) returns the Mumbai revenue, regardless of the slicers. It is the workhorse of every model.FILTERWraps a table expression and keeps only the rows that match a condition. Most often used inside CALCULATE. =CALCULATE(SUM(Sales[Amount]), FILTER(Customers, Customers[Segment]=“Enterprise”))ALLRemoves a filter. =CALCULATE(SUM(Sales[Amount]), ALL(Region)) returns the total across every region, ignoring the regional slicer. Essential for percent-of-total measures.DATEADD / SAMEPERIODLASTYEARTime intelligence. DATEADD(Date[Date], -1, YEAR) gives you the prior year. TOTALYTD gives you year-to-date. These two functions replace most of the date math that finance teams re-invent by hand.
The five-step architecture we ship to every client
Power Pivot is not an island. The reason it is fast is the architecture around it. Every Power Pivot model we ship follows the same five-stage structure. The team that opens the workbook sees a dashboard and a few pivot tables. The data sits underneath, refreshed by one click.
- 1
Source files in a folder (or one Power Query connection per source).
- 2
Power Query cleans each one, applies the same column types, outputs to the Data Model.
- 3
The Data Model holds every cleaned table, with relationships defined by clicks.
- 4
A small set of measures - maybe fifteen total - live in the model.
- 5
The pivot tables, charts and dashboards on the visible sheet read from the model. They never touch the raw data.
Build the first model this week
The best way to learn Power Pivot is to build one model. Pick the report that has the most VLOOKUPs. Replace each VLOOKUP with a relationship in the model. Replace each SUMIFS with a measure. Build the pivot table on top. The report is the same, the formulas are gone, the refresh is one click, and the file stays fast at ten times the data. Power Pivot rewards the people who learn it well with workbooks that survive the second year - and the team that uses them never has to know the model is there.















