

A pivot table is the fastest route from “here is a 40,000-row export” to “here is the answer”. Yet most people stop at drag-and-drop sums. Here is the workflow we teach every client team.
- 1
Format your source as a Table first
Press Ctrl+T before you build anything. A proper Table gives your pivot a named, growing source - new rows are picked up on refresh instead of silently falling outside the range.
- 2
Think in questions, not fields
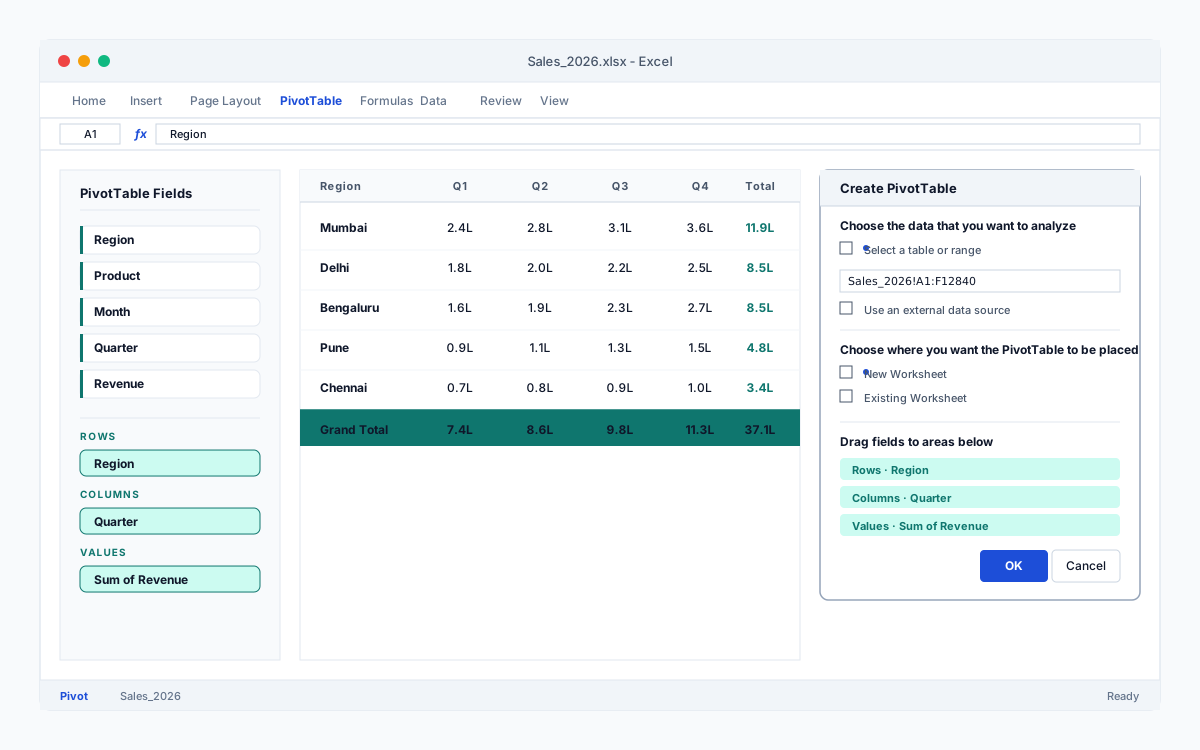
Do not ask “what do I drag where?” Ask “revenue by region by month” - the sentence maps directly: revenue goes to Values, region to Rows, month to Columns.
- 3
Use Show Values As
Right-click any value and choose “% of Grand Total”, “Difference From” or “Running Total”. This is where a table of numbers turns into an actual insight - which region is growing, which product is fading.
- 4
Add slicers for the people who fear pivots
A slicer is a set of friendly filter buttons. Colleagues who would never touch a field list will happily click a slicer - which means your analysis actually gets used.
The five-minute habit
Next time someone sends you a raw export, resist writing formulas. Table it, pivot it, ask one question. Five minutes later you will know more than an hour of manual filtering would have told you.














