

Most Excel dashboards are built once, emailed around, and never opened again. The problem is almost never the data - it is the design. Here is the checklist we run every client dashboard through, in the order that makes the most difference.
Why dashboards die
The graveyard is the same in every company: a folder called "final" or "final_v2" or "final_actual_final". The reason is rarely that the numbers are wrong. It is that the reader cannot tell, in the first three seconds, whether the dashboard needs their attention today. A dashboard that survives is a dashboard that makes the answer obvious before the question has to be asked.
The six-point design checklist
- 1
One screen, one question
If a dashboard needs scrolling, it is a report, not a dashboard. Pick the one question the user opens the file to answer, and design the layout to answer it before they have to ask.
- 2
Number first, chart second
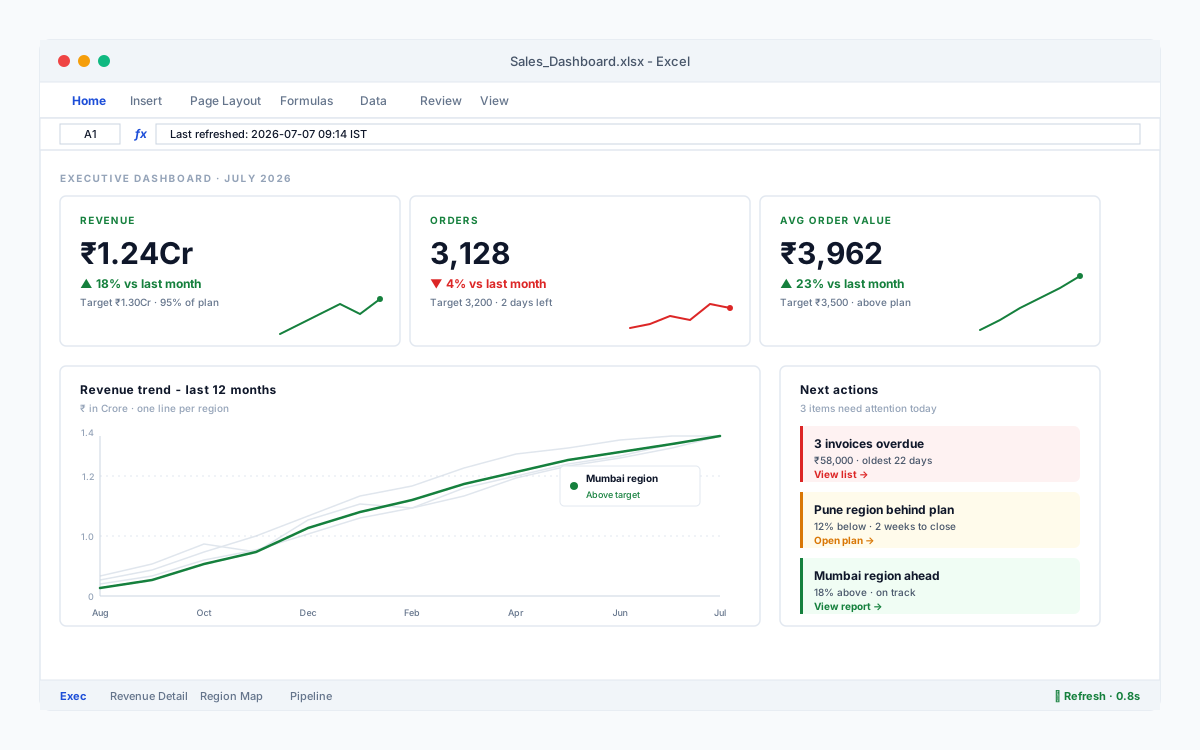
A dashboard exists to communicate a status. The headline number is the status ("Revenue $1.24M"). The chart is the proof (the trend behind it). Lead with the number; let the chart be the footnote.
- 3
Show the comparison, not the absolute
$1.24M is a fact. "Up 18% on last month, 6% above target" is a story. Every headline number on a dashboard should sit next to at least one comparison - previous period, target, or both.
- 4
Use color to mean something
Green when the metric is good. Red when it is bad. Grey for everything else. The moment a dashboard uses four colors, the reader has to keep a legend in their head, and they stop reading.
- 5
Update in under thirty seconds
If refreshing a dashboard takes longer than the reader's attention span, they will stop opening it. Drive the data from a Table or a Power Query connection, and "refresh" becomes a single click.
- 6
Place the next action next to the number
A dashboard that ends with a status leaves the reader thinking "so what?". A dashboard that ends with "3 invoices overdue - click to see them" makes the next move obvious.
The test
Hand the dashboard to a colleague who has not seen it before. Time how long it takes them to answer the question the dashboard is supposed to answer. Under ten seconds means the design is working. Over thirty means you have built a report and called it a dashboard. A dashboard that gets opened is a dashboard that earns its keep - and the design is what makes it earn that keep.














