

A working finance team does not need sixty reports. It needs seven - the ones the controller opens every Monday morning, the ones the CFO scans before the board pack is final, the ones that answer the question that is actually being asked. Here is the list, in the order finance teams ask for them, and the Excel pattern behind each one.
The seven reports, in the order finance teams ask for them
Finance teams across manufacturing, retail, services and SaaS use this kind of report pack. The list is the same. The order is the same. The only things that change are the line items, the entities, and the cadence.
- 01
Weekly Cash Position
· Every Monday morningOpening balance, receipts, payments, closing balance, and a 13-week rolling forecast. The single most-asked report in any finance team - and the one a CFO opens before anything else. Built off one source table (the bank) and one SUMIFS by week.
- 02
Receivables Aging
· Weekly, with daily exception view0-30, 31-60, 61-90, 90+ buckets with customer name, invoice, owner, and amount. The report that turns a balance sheet line into a list of phone calls. Built off a single XLOOKUP against the customers table.
- 03
Payables Aging & Payment Run
· Twice a week, ahead of payment runsVendor dues, discount-capture opportunities (the 2/10 net 30 line items you keep forgetting to claim), and the cash required for the next payment run. Pairs with the receivables aging to answer "what is our real cash position next Friday?".
- 04
P&L vs Budget (MTD and YTD)
· Month-end within 3 working daysActual, budget, variance in absolute and percent, by entity and by line. The variance column is the report - it is the column the CFO scans, not the actuals. Built off a single SUMIFS across the GL with two criteria (period, line).
- 05
Working Capital Snapshot
· MonthlyDSO, DPO, inventory days, and the cash conversion cycle. Four ratios that summarise whether operations is funding the business or the other way around. Each ratio is a one-line formula off the aging reports - no extra data needed.
- 06
Trial Balance & Top Reconciliations
· Month-end, pre-closeThe TB, the top 10 reconciling items per balance, and the unexplained balance. The report the auditor asks for first, and the one that surfaces problems before the close meeting rather than during it.
- 07
KPI Pack (one page)
· Weekly, board-qualityRevenue, gross margin, EBITDA, cash, headcount, customer count, on a single page, with the same period last year and a sparkline. The single page a board packs for the meeting. Seven tiles, one screen, one click to refresh.
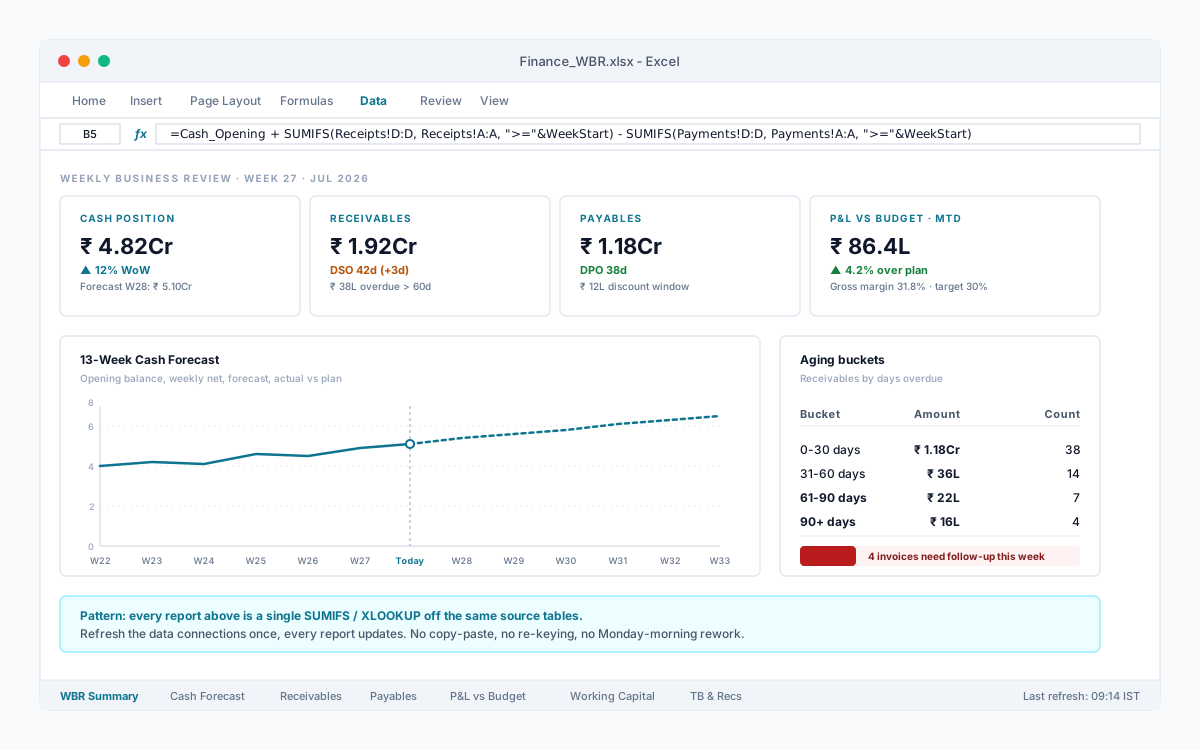
The pattern behind every one of them
Strip the seven reports down to their structure and you get the same three patterns, repeated. These are the design choices that decide whether the pack survives the second month.
- 1
One source of truth per number
Every total in every report traces back to a single Table or Power Query connection. The customer list, the GL, the bank feed - each one lives in one place. The reports do not store numbers; they display them.
- 2
Named ranges for the assumptions
GST rate, FX rate, fiscal year start - all named cells on a hidden tab. A change to a rate is a change to one cell, and every report picks it up on refresh. No Find & Replace, no broken formulas.
- 3
A single refresh point
Press one button, every report updates. The mechanism is Power Query for inbound data, Tables for the in-workbook source, and named ranges for the assumptions. If refreshing the pack takes longer than 30 seconds, the architecture is wrong.
The 5-question audit of your current report pack
Before you build the seven, audit what you have. Five questions, fifteen minutes, and you will know which report to fix first. The answer is almost always the cash position.
- 1Do we have a report that answers the question the CFO asks on Monday morning?
- 2Does each report refresh in under 30 seconds from a single click?
- 3Can a colleague who did not build the report explain what each number means?
- 4Is the variance or comparison next to every headline number, not buried below?
- 5If a source number changes by 1%, does every downstream report update on refresh?
Start with one
The easiest first report is the Weekly Cash Position. One source table (the bank), one SUMIFS by week, one 13-week forecast column, and one comparison to last week. A half-day build turns into a report the CFO will open every Monday for the next five years. Build that one first, ship it, then build the next. Seven weeks, seven reports, one report pack the team owns.














